Studio
Studio is where you ask the register a question and get it back as a picture or a list. Ask for a dashboard and Manifest builds one you keep and edit; ask for a report and you get a table of assets to export. Four figures from the register sit across the top either way you look.
- For
- Asking for a dashboard of charts or a report of assets in one line, and opening the rows behind any figure or bar.
- Will not
- Change a dashboard by asking. Every prompt builds a new dashboard; to change one you already have, edit its widgets. A click on a chart only opens rows for an asset bar or donut grouped by one field. Stacked bars and trends stay hover-only.
- Writes
- Dashboards and their widgets, and saved reports, which keep the prompt, not the rows. The register itself is never changed from here.
What you are looking at
Studio is one screen with one header. The toggle picks what the ask field builds; the rest of the header changes with it.
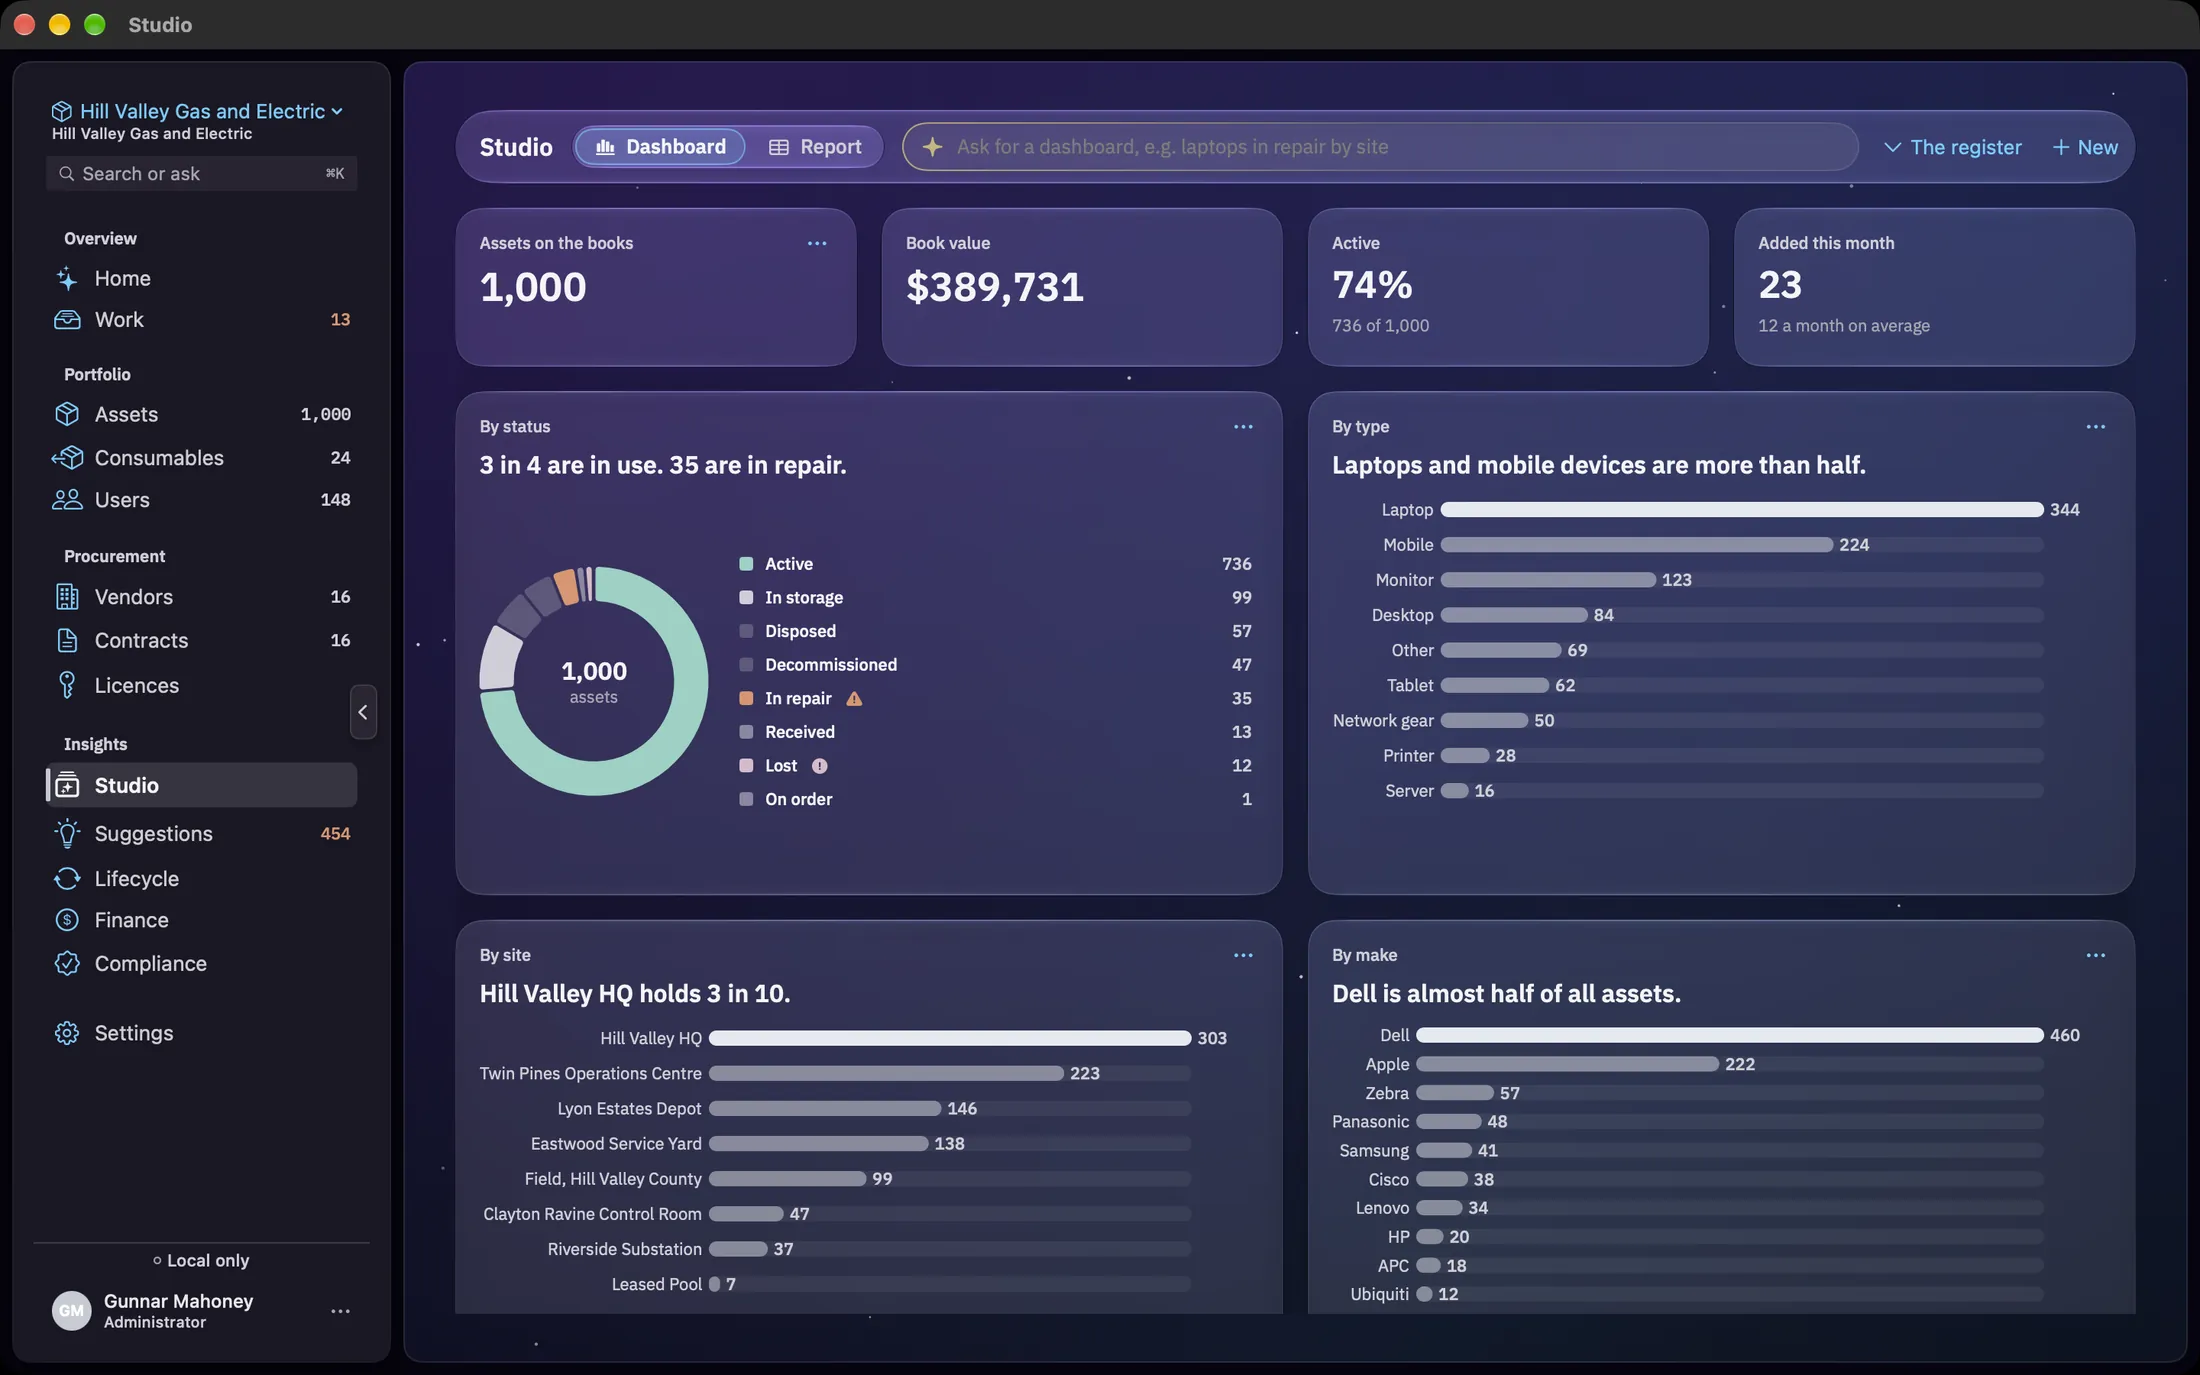
The header reads, left to right: Studio, the Dashboard | Report toggle, the ask field, then the controls for whichever side is selected. On Dashboard those are the dashboard picker (showing the open dashboard’s name, or All dashboards) and New. On Report there is a Saved menu once you have saved a report.
The ask field, marked with a ✦, changes its placeholder with the toggle. On Dashboard it reads Ask for a dashboard, e.g. laptops in repair by site; on Report it reads Ask for a report, e.g. assets overdue for verification. Type, then press Return or click Generate, which appears once there is something to run. A spinner takes its place while Manifest works.
The four figures
Across the top of the Dashboard side sit four figures read from the register, whichever dashboard is open. Each is the same number another screen shows, and each opens what it counted.
- Assets on the books is the count on the Assets screen’s All. Click it to open every asset.
- Book value is the figure Finance shows. Click it to open Finance. With no purchase prices recorded yet it reads No prices yet.
- Active is the share of assets with the Active status, with the count under it (736 of 1,000). Click it to open the Assets screen on the Active chip.
- Added this month counts assets recorded this calendar month, with the monthly average before it underneath (12 a month on average). Click it to see those assets as a report.
If the open dashboard has a widget that counts every asset with no filter, it is not drawn twice: it becomes the Assets on the books figure, and that figure gains the widget’s ••• menu so you can still edit or delete it. That is why only the first figure in the picture has a menu.
Choosing a dashboard
A dashboard is a saved set of widgets. The picker in the header moves between them; New starts one.
Studio opens on your dashboards, a grid of cards under Your dashboards. Each card shows the dashboard’s name, its widget count and the date it was made. Click one to open it, or right-click for Delete dashboard. With no dashboards yet you see Ask for a dashboard instead, with three prompts to click: Assets by status, Laptops in repair by site and Spend by vendor.
The picker lists every dashboard, with a tick beside the open one, then All dashboards to go back to the cards. With a dashboard open it also holds Refresh and Delete this dashboard, which asks first and says what it does: Its widgets go with it. The register is not touched.
New holds two things. Dashboard… asks for a name and makes an empty dashboard. Widget on this dashboard… opens the widget editor for the open dashboard; it is greyed out on the cards. An empty dashboard says This dashboard is empty, with an Add a widget button.
The register is one of the dashboards the demo register comes with, next to Risk and evidence and Spend. It is an ordinary dashboard: edit its widgets, or delete it from the picker, like any other. Your own register starts with none.
Asking for a dashboard
Describe the whole dashboard in one sentence and Manifest builds it, saves it, and opens it.
Ask
With Dashboard selected, type what you want to see, such as laptops in repair by site, and press Return.
Read the note
The new dashboard opens with a note above it. The note says who planned it, Matched to the register by keyword. or Planned by Apple Intelligence., then what was built: Built 3 widgets, and, when they apply, 1 couldn’t be built, 1 value to confirm or 1 filter couldn’t be applied. Only a plan the model made wears the ✦.
Confirm any values
A value to confirm is a question with a menu beside it, listing only values your register holds. Pick one and that widget’s filter is set. Dismiss the note with its close button when you are done.
What you get is a normal dashboard, named after what you asked, in the picker with the rest. Edit, move or delete its widgets as you would any other. Asking again always makes another dashboard; it never changes the open one.
If nothing in the prompt matched a status, type, site, make or field the register holds, nothing is built and nothing is saved. The note says so, and suggests laptops in repair by site to try.
Keywords go first. A planner grounded in your register reads the common asset questions, and the on-device model is only asked when that planner cannot read the prompt with confidence. That is why the same prompt tends to build the same dashboard twice. If neither can read it, you get the note above, never a best guess.
Editing a widget
Every widget has a ••• menu. Edit widget opens an editor where every picker is filled from the fields your register actually has.
The ••• menu on a chart holds Edit widget, Duplicate, Show the numbers (which swaps the chart for its figures as a list, and back with Show the chart), Move earlier, Move later and Delete. A single figure’s menu holds only Edit widget and Delete.
The editor opens as New widget or Edit widget. Its sections are Widget (a title, optional and named for you if left blank, and the Type: Number, Scorecard, Bar, Line, Donut, Gauge or Table), Data source, then the sections the type needs, and Filters for all of them.
- Measure & grouping appears for bar and donut, with Group by. Bar also has Break down by, which turns it into a stacked bar with a second field.
- Measure is the sum you want: Count of records, Distinct count, Sum, Average, Minimum or Maximum. Anything but Count of records adds Of, the field it applies to.
- Trend over time appears for line and scorecard: a Date field and Bucket by Day, Week, Month, Quarter or Year.
- Gauge takes Band edges (for example
50, 80) and a switch for Value is a percentage (0–100). Below the first edge shows red, the top band green, the middle amber. - Columns replaces the measure for a table: tick the fields to show.
- Filters is a list of field, condition and value rows. Add one with Add filter; remove one with the minus button at its end.
Add widget or Save checks the widget before saving it. If the combination does not work, the footer says why: Pick one group-by field and one measure., A trend needs a date field and a time bucket., Pick at least one column., and so on. The editor stays open until the save lands.
Reading a widget
Every chart card is the same height, headed by its name and one line saying what it shows. Some of them open the rows they counted.
The line under a chart’s name, such as 3 in 4 are in use. 35 are in repair., is worked out by fixed rules from the widget’s own numbers, never by a model. When no rule fits, or the result was cut short, the card shows no line rather than a weak one.
A Number sits as a figure in a row above the charts. A Gauge is a dial tinted by its bands. Line and Scorecard draw a trend, with the latest period marked, the first and last periods named on the axis, and empty months drawn as zero. A Table draws its rows in a scrolling grid, up to 200 of them.
Bar charts are one colour, with the largest bar picked out. A status Donut uses colour for meaning only: Active in green, In repair in amber with a warning triangle in the legend, Lost or Stolen with a !, and the other statuses in greys. Groups the chart had no room for are said under it, And 12 more, not drawn.
Hover a bar or a legend row for its value. When it can be opened, the tooltip adds Click to see them. On a status donut with no filters, Active, In repair and In storage open the Assets screen on that chip. Every other bar or slice opens the Report side on exactly the rows it counted, with the widget’s own filters kept, headed The rows behind a chart.
Only asset bar and donut charts grouped by one field can be opened. Stacked bars, trends and charts over other records stay hover-only. When a query returned more groups than it could show, the card says Showing the first groups only. Add a filter to see them all.
Building a report
Switch the toggle to Report and the ask field builds a table of assets instead of a dashboard. A report is not saved until you say so.
With Report selected and nothing asked yet, the screen shows Ask for a report, with the line Describe the assets you need, “unassigned laptops”, “warranty expiring”, and export the table as CSV. Four prompts sit under it: Unassigned laptops, In repair, Overdue verification and Warranty expiring.
Ask, and the table has five columns: Asset tag, Model, With, Site and Status. An asset with nobody reads Unassigned, and one with no site reads No site.
Above the table are your question and who read it: Matched by keyword or Read by Apple Intelligence, then the count (12 assets). Keywords go first here too; the on-device model only gets a turn when words are left over. When leftover words were searched for, a line says where: Also searched tags, serials, makes, models, holders and sites for them, so an empty table is not taken for none.
Export CSV opens a save panel, with your question in lower case and hyphens as the file name. The file carries the full set of asset columns, not only the five on screen.
If nothing matched, the screen says No matching assets. If the report could not be read at all, it says Couldn’t build the report with the reason.
Saved reports
A report you run often can be saved and run again from a menu. Saving keeps the question, not the rows.
Save beside Export CSV saves the report under the question you asked. Saved reports appear in two places: the Saved menu in the header, and a Saved reports list on the empty Report side, where the bin beside each one deletes it.
Choosing a saved report asks its question again, so the table is always the register as it is now. The rows behind a chart or a figure cannot be saved, because there is no question to keep; Save does not appear for them.
Where prompts come from
Studio is not the only place a question can start. The Assets screen can hand one in.
On Assets, Dashboard from this view and Report from this view open the Studio with the list’s current view already asked, in words, on the side you chose. You are not rebuilding the filter at the other end.
Charts you build here can also sit on Home, pinned from Settings under Home charts. Edit widget on a pinned chart brings you back to the Studio.